Explore Real-Time Cryptocurrency Price Charts
Visualize the performance of top cryptocurrencies with comprehensive price charts. See historical trends, compare market leaders, and examine the factors driving price changes across popular digital assets.

CryptoQuant provides comprehensive on-chain data and market analysis, making it an essential tool for cryptocurrency traders and investors.

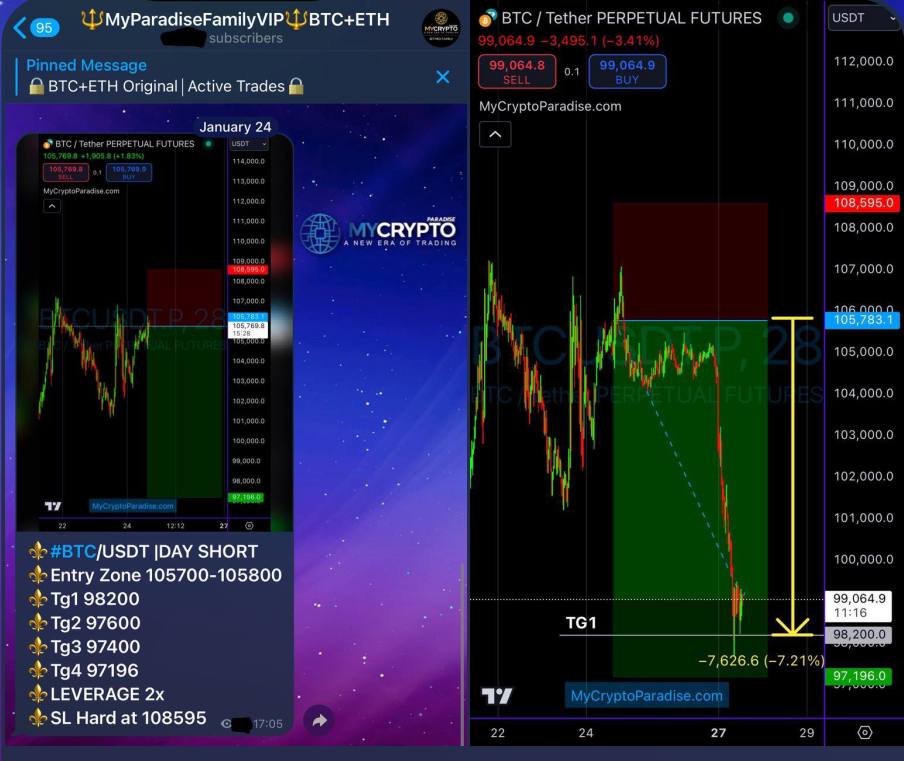
MyCryptoParadise is the most professional crypto signals trading company out there, but it is expensive. It’s not for everyone - only for people who are serious about trading. MyCryptoParadise provides ENTRY/EXIT signals for VIP members and offers market predictions and analysis for FREE.
Real-Time Cryptocurrency Price Charts
CryptoQuant
CryptoQuant is a leading platform for on-chain data and market analysis, offering users access to vital information such as exchange flows, miner behavior, and whale activity. With its intuitive interface and robust data sets, CryptoQuant caters to traders seeking to predict market movements with confidence. The platform’s real-time alerts keep users informed of critical events like large transactions or shifts in exchange reserves, empowering them to react swiftly to market changes. Its advanced tools allow for in-depth analysis of Bitcoin, Ethereum, and other cryptocurrencies, making it a top choice for professionals and enthusiasts alike. Whether you’re planning your next trade or analyzing long-term trends, CryptoQuant delivers actionable insights at your fingertips.
Perks
Data Insights
Analyze exchange flows, miner activities, and whale movements for a comprehensive understanding of the market.
Supported Cryptocurrencies
Bitcoin (BTC), Ethereum (ETH), and other major cryptocurrencies.
Welcome bonus
CryptoQuant provides comprehensive on-chain data and market analysis, making it an essential tool for cryptocurrency traders and investors.
MyCryptoParadise
MyCryptoParadise crypto signals PRO trading company is the only crypto trading service operated by former hedge fund traders. They are known as ParadiseTeam, and they are doing their best to change the crypto trading industry that is flooded by get-rich-quick schemes, into a professional trading space where everyone is trading with a systematic strategy and focusing on long-term, consistent, and safe trading results.
They offer FREE services with insider market insights and Bitcoin + Altcoins predictions to help traders navigate uncertain markets with confidence.
Additionally, they have a few exclusive trading seats in ParadiseFamilyVIP, providing a rare opportunity to directly witness their LIVE trading. ParadiseTeam discreetly shares their personal trade setups, including clear BUY/SELL targets, exclusively with the VIP members who secured these limited seats within their inner circle.
Inside ParadiseFamilyVIP, you won’t just see how professional crypto traders operate - you’ll feel it firsthand, experiencing exactly how former hedge fund traders calmly and systematically manage trades, turning complex market moves into clear, confident actions that dominate the crypto market.
Perks
Data Insights
They called the top for BTC at $109k on their YouTube channel and inside their free telegram channel.
Supported Cryptocurrencies
Bitcoin (BTC), Ethereum (ETH), and other major cryptocurrencies.
Welcome bonus
MyCryptoParadise is the most professional crypto signals trading company out there, but it is expensive. It’s not for everyone - only for people who are serious about trading. MyCryptoParadise provides ENTRY/EXIT signals for VIP members and offers market predictions and analysis for FREE.
Cryptocurrency Price Charts Overview
-
Introduction: Cryptocurrency price charts are essential tools for tracking market movements and identifying potential investment opportunities. From Bitcoin to smaller altcoins, price charts reveal trends and volatility, helping investors assess the current market sentiment and predict future directions.
-
Real-Time Data: Cryptocurrency price charts are updated in real-time, allowing users to view the latest pricing information across major digital assets:
- Bitcoin (BTC): As the leading cryptocurrency, Bitcoin's price chart shows significant price movements, which often influence the broader crypto market. Real-time charts allow investors to follow Bitcoin’s peaks, dips, and overall market impact.
- Ethereum (ETH): Ethereum’s price chart is a valuable resource for those following decentralized finance (DeFi) and blockchain application trends. Ethereum’s real-time chart reflects its role in supporting various platforms and innovations in the blockchain ecosystem.
- Ripple (XRP): Ripple’s XRP price chart demonstrates its impact on the cross-border payments industry. The chart data for XRP reflects how regulatory updates and partnerships affect its market position.
-
Chart Types and Analysis Tools: Various chart types and technical analysis tools help deepen market insights:
- Line and Candlestick Charts: Line charts offer a straightforward view of price changes over time, while candlestick charts provide detailed information on daily opening, closing, high, and low prices. Candlestick patterns are essential for identifying price trends and reversals.
- Moving Averages: Moving average indicators, such as the simple moving average (SMA) and exponential moving average (EMA), help smooth out price data, making it easier to identify market trends and potential entry or exit points.
- Volume Analysis: Volume charts show the trading volume for each asset, allowing users to understand the intensity of buying and selling activity, which can indicate trend strength or potential reversals.
-
Top Charts for Market Leaders: Dedicated charts for top-performing cryptocurrencies are available to help investors analyze market trends:
- Bitcoin (BTC): Bitcoin’s chart highlights its influence on the market, showing price movements that can impact altcoin prices and overall market trends. The chart data allows users to analyze long-term trends and volatility unique to Bitcoin.
- Ethereum (ETH): Ethereum’s price chart displays its performance relative to its technological developments, network upgrades, and market interest in DeFi and NFTs. The chart reveals how these factors shape ETH’s market position.
- Litecoin (LTC): Known for its fast transaction speeds, Litecoin’s price chart shows trends in adoption as a payment method and its position within the crypto market. Litecoin’s chart can help assess its growth potential alongside other digital payment assets.
-
Benefits of Using Price Charts:
- Identify Trends: Cryptocurrency price charts help investors spot bullish or bearish trends and make informed decisions based on market direction.
- Analyze Volatility: By examining historical price movements, investors can evaluate an asset’s volatility, aiding in risk management strategies.
- Track Market Sentiment: Charts reflect the current sentiment in the market, as seen through price fluctuations and trading volumes, offering insights into overall investor confidence.
Cryptocurrency Price Chart FAQ
-
How frequently are price charts updated?
- Price charts update in real-time, reflecting the latest trades across global cryptocurrency exchanges. This ensures users have access to the most current data for informed analysis.
-
What tools are available for chart analysis?
- A range of tools are available, including line and candlestick charts, moving averages, volume analysis, and RSI (Relative Strength Index) for a comprehensive analysis experience.
-
How can charts help predict price movements?
- By studying chart patterns, such as trend lines, support and resistance levels, and candlestick formations, users can make informed predictions about potential price movements.
-
What factors influence the trends shown in price charts?
- Cryptocurrency trends are influenced by market demand, regulatory developments, technological advancements, and macroeconomic conditions. Studying these elements alongside chart data helps interpret price trends.
-
Can multiple cryptocurrencies be tracked in one chart?
- Yes, some charting platforms allow users to compare multiple cryptocurrencies within a single chart for cross-asset analysis. This feature is especially useful for understanding how assets correlate in different market conditions.


